Project
![]()
Thermodynamics of the interaction of betacoronaviruses with human cell receptor
Termodynamika oddziaływań beta-koronawirusów z receptorami komórek ludzkich
OPUS-19 (UMO-2020/37/B/NZ6/01476)
The charactaristic of betacoronaviruses
Coronaviruses are enveloped, large, moderately pleomorphic, positive-stranded RNA (+ssRNA) viruses belonging to the family Coronaviridae. They are divided into four major genera: Alphacoronaviruses, Betacoronaviruses, Gammacoronaviruses, and Deltacoronaviruses. Both severe acute respiratory syndrome coronavirus-1 (SARS-CoV-1) and severe acute respiratory syndrome coronavirus-2 (SARS-CoV-2) belong to the genus Betacoronavirus.
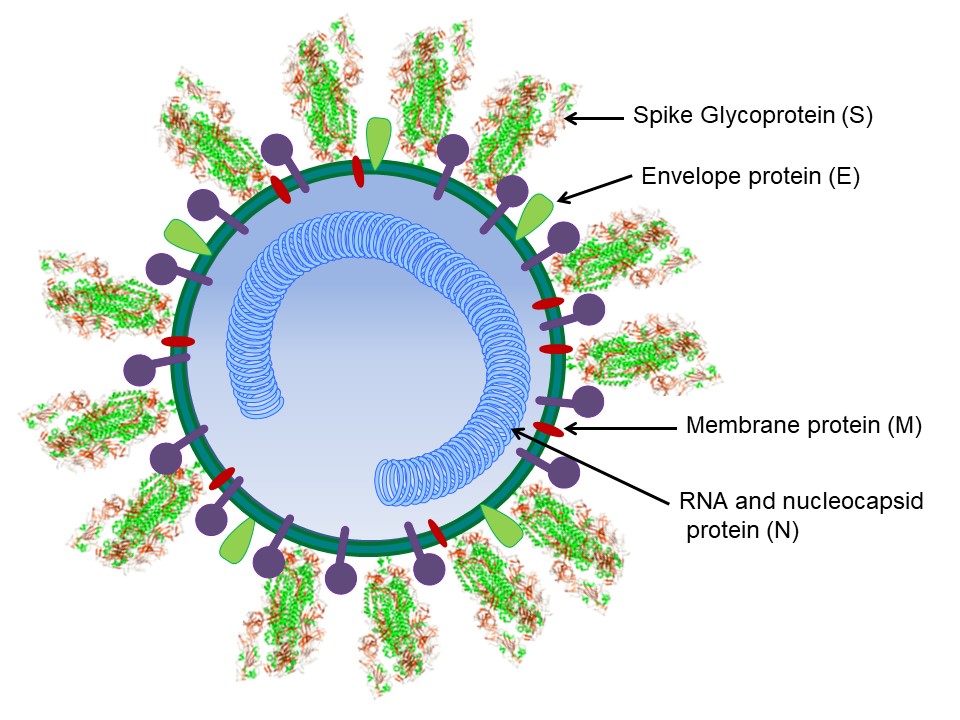
SARS-CoV-1 (responsible for the SARS epidemic in 2002-2004) and SARS-CoV-2 (responsible for COVID -19) share many similarities. Both viruses cause respiratory diseases transmitted by contact with infected individuals. The genomes of SARS-CoV-1 and SARS-CoV-2 have 79.5% sequence identity and encode the non-structural replicase polyprotein, four structural proteins: spike (S), envelope (E), membrane (M), and nucleocapsid (N), and several additional non-structural proteins called accessory proteins (Figure 1).
Figure 1. A schematic diagram of the betacoronavirus structure
Membrane proteins, the most abundant proteins in coronaviruses, are responsible for the shape and size of virions. In addition, the M protein is responsible for the processing, modification, and transport of many viral compounds, as well as the formation and release of new virions. The M protein of SARS-CoV-2 has 90.5% homology with the M protein of SARS-CoV-1. The envelope protein is multifunctional and participates in virion particle assembly and budding. The nucleocapsid protein enters the host cell with the coronavirus genetic material and enables replication, RNA transcription, assembly and release of the virus. The N protein of SARS-CoV-2 is approximately 90% similar to the N protein of SARS-CoV-1.
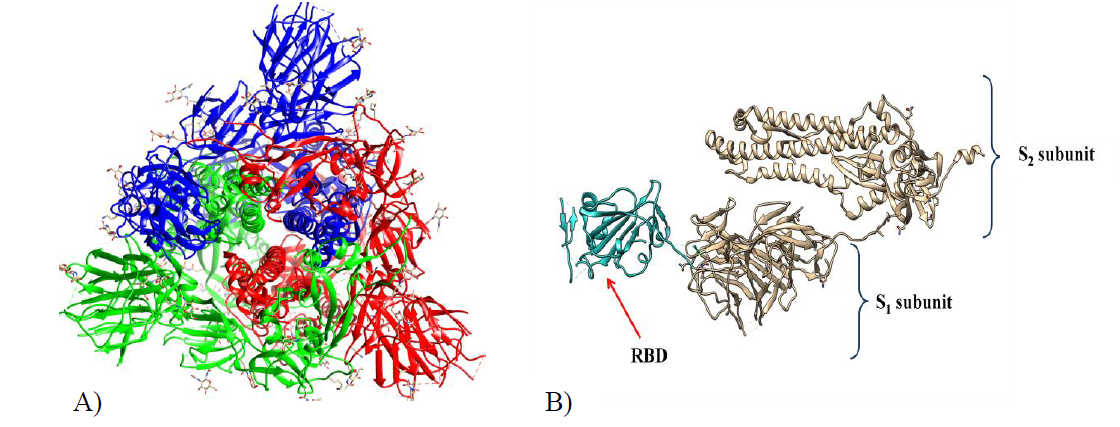
The spike protein (150 kDa) is a highly glycosylated homotrimer (Figure 2A) that is distributed on the surface of the virion particles and protrudes radially from the viral envelope, forming a „crown-like” structure. The S-glycoprotein is responsible for the binding of the virion to the host receptor, its fusion with it, and entry into the virus. Both SARS-CoV-1 and SARS-CoV-2 utilize angiotensin-converting enzyme 2 (ACE2), an enzyme found on the outer surface of a variety of cells, as their cellular receptor.
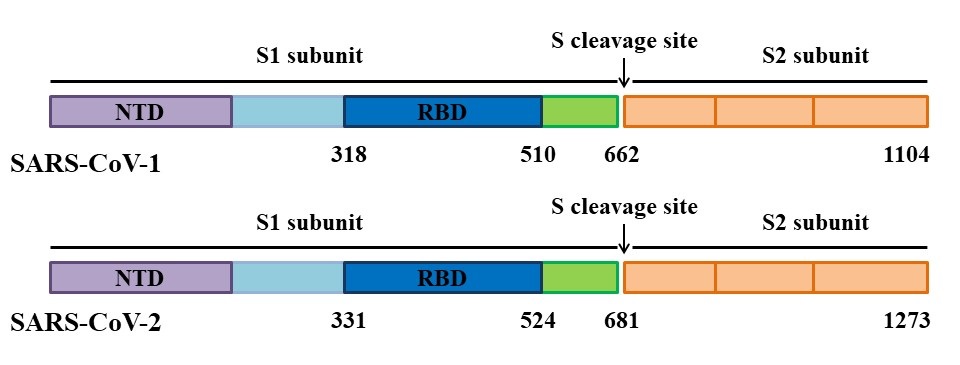
Each monomer of spike consists of three segments: an ectodomain, a transmembrane anchor, and an intracellular tail. Two subunits can be distinguished in the ectodomain of the S protein. The amino-terminal subunit (S1) is responsible for the binding of the virus to the ACE2 receptor, while the carboxyl-terminal subunit (S2) is responsible for the fusion of the virion with the cell membrane, during which it undergoes a conformational change and rejects the S1 subunit (Figure 2B). The spike proteins of SARS-CoV-1 and SARS-CoV-2 differ in length. The S protein of SARS-CoV-1 contains 1255 amino acid residues, while the S protein of SARS-CoV-2 has 1273 amino acid residues. The S1 subunit of coronaviruses includes the N-terminal domain (NTD), the receptor-binding domain (RBD), and two subdomains SD1 and SD2, while the S2 subunit contains a fusion peptide (FP) and two heptad repeat regions (HR1 and HR2) (Figure 3).
Figure 2. Overall structure of the S protein protomer of SARS-CoV-2. Left: Each monomer of the S protein protomer is represented by a different color. Right: Monomer of the SARS-CoV2 spike protein during the “up” conformation. The receptor binding domain (RBD) has been shown in cyan. Visualized by USCF Chimera. PDB ID:6VSB
Figure 3. Schematic representation of the S protein organization of SARS-CoV-1 and SARS-CoV-2.
.A critical first step for SARS-CoV-1 and SARS-CoV-2 entry into host cells is binding to the ACE2 receptor. A receptor-binding domain (RBD) located in the middle region of the S1 subunit specifically recognizes ACE2 and binds to the membrane portion of the receptor’s claw-like structure (Figure 3). That domain is the most variable part of the coronavirus genome. The RBD region of SARS-CoV-1 and SARS-CoV-2 has a sequence identity of approximately 73-76%. Many findings suggest some internal sequence and structural differences between the RBD of SARS-CoV-1 and SARS-CoV-2. The RBD of SARS-CoV-1 and SARS-CoV-2 spans full-length amino acid residues 318-510 and 331-524 of the S protein, respectively (Figure 3).
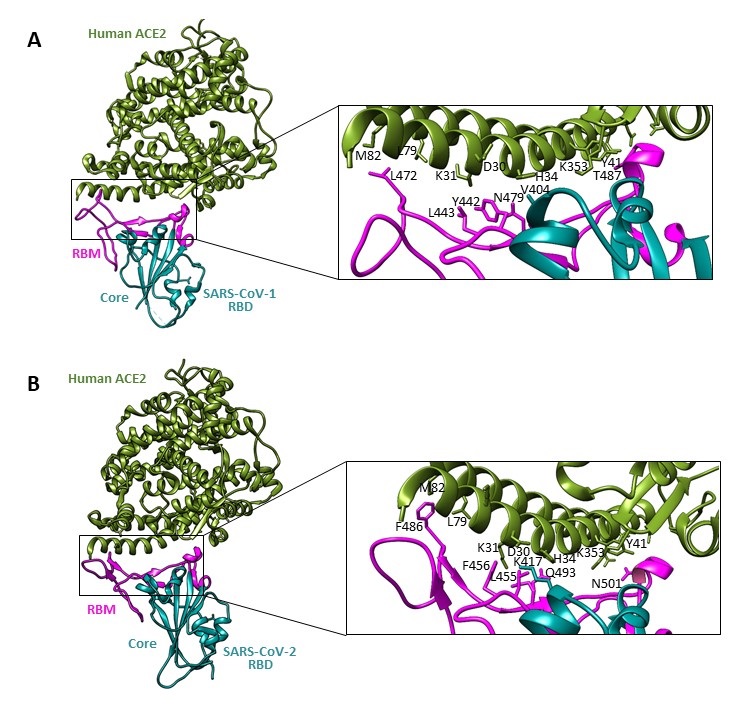
The interacting amino acid residues of spike RBD are situated on a loop, as is shown in Figure 3. Despite the fact that the overall structure of SARS-CoV-2 S protein resembles that of SARS-CoV-1, the S protein of virus causing COVID-19 disease shows the higher number of protein-protein contacts and the longer loop capping ACE2 in comparison with SARS-CoV-1 (Figure 4).
Figure 4. Comparisons of interactions at the SARS-CoV-1 RBD-ACE2 (A) and the SARS-CoV-2 RBD-ACE2 (B) interfaces. Contacting altered residues are shown as sticks and labeled. ACE2 is green, the core of RBD is in cyan, and RBM is in magenta. PDB ID for SARS-CoV-2 RBD-ACE2 is 6M0J; PDB ID for SARS-CoV-1 RBD-ACE2 is 2AJF.Visualized by USCF Chimera
The main aim of the project
The main aim of the project is to understand the interaction of the SARS-CoV-2 spike (S) protein and the cell receptor (angiotensin converting enzyme 2, ACE2) of humans.
Detailed thermodynamic and structural studies will answer to the questions: “What “strategy” SARS-CoV-2 uses to invade human cells?” and “Why does it spread so easily?”.
Thermodynamical and structural analysis of the interaction of the SARS-CoV-1 S1 protein and its RBD with a human cell receptor (hACE2) and SARS-CoV-2 S1 protein and its RBD with a human cell receptor (hACE2)
Isothermal titration calorimetry (ITC) is the most efficient quantitative method to determine the thermodynamic properties related to interactions between two molecules. By this fast and label-free technique the conformational changes and dissociations constants can be readily quantified (Figure 5).
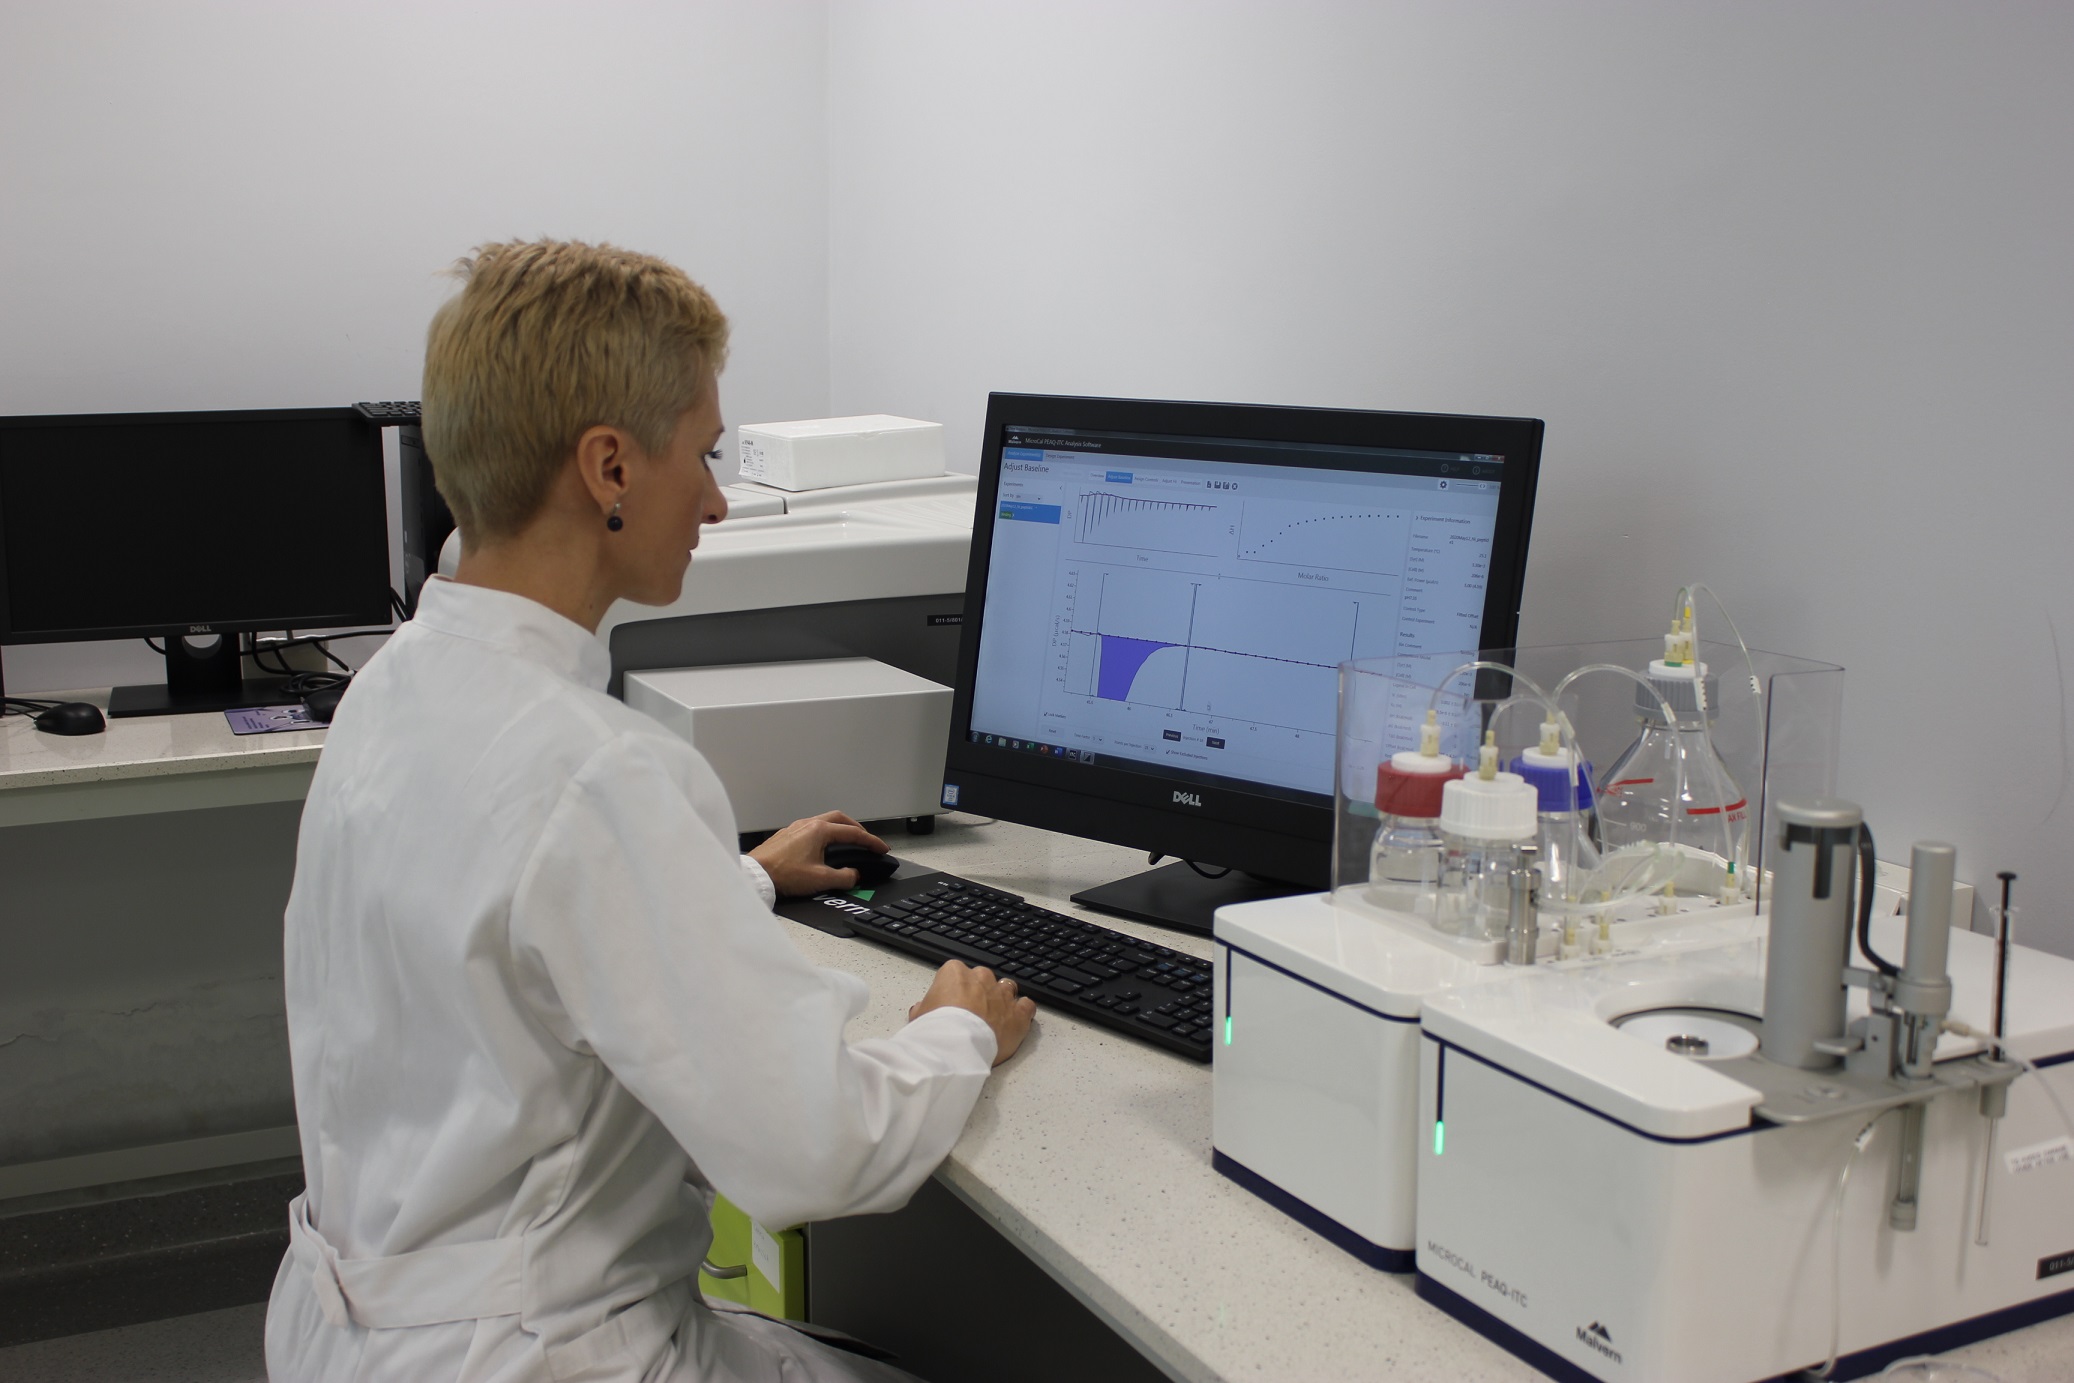
The aim this part of project is to obtain reliable data on binding affinity, stoichiometry, enthalpy and entropy of the interaction of the SARS-CoV-1 spike (S) protein and SARS-CoV-2 spike (S) protein with the human cell receptor (hACE2) protein using ITC technique (MicroCal PEAQ-ITC, Malvern).
All measurements were performed under the same conditions (buffers, pH, temperature). That gave us information how much the affinity of the SARS-CoV-2 S2 protein for ACE2 differs from the affinity for SARS-CoV S1, and if there are any differences in the enthalpy and entropy of these reactions
Figure 5. ITC technique.
Results
Comparison of the thermodynamics of binding of SARS-CoV-1 S1 RBD and SARS-CoV-2 S1 RBD to the hACE2 receptor
There are many reports on the binding strength and conformation of the S1-RBD protein during interaction with the human ACE2 receptor, for both SARS-CoV-1 and SARS-CoV-2. However, due to the different techniques used (with variable experimental conditions) and the different S1-RBD and ACE2 variants studied, it is difficult to compare the binding affinity and other characteristics of ACE2 binding to RBDs of different Betacoronaviruses.
Regardless, the interactions of the S1 protein of SARS-CoV-2 and its RBD with the human ACE2 receptor protein have already been studied under variable and not always well-defined conditions. Reported affinity (Kd) values range widely from 1-133 nM. The S1 protein of SARS-CoV-1 and its binding to the human ACE2 receptor was also studied. The Kd value of these interactions varied from 5 to 325.8 nM. These studies were mainly performed with surface plasmon resonance (SPR) or biolayer interferometry (BLI).
In our study, the interactions were investigated under identical experimental conditions. Even dialysis of all binding partners (RBDCoV1, RBDCoV2 and ACE2 proteins) was performed simultaneously in the same buffer.
After exhaustive dialysis against PBS buffer, pH 7.4, the interactions of RBDCoV1 and RBDCoV2 with the hACE2 receptor were investigated ITC (Table 1, Figure 6).
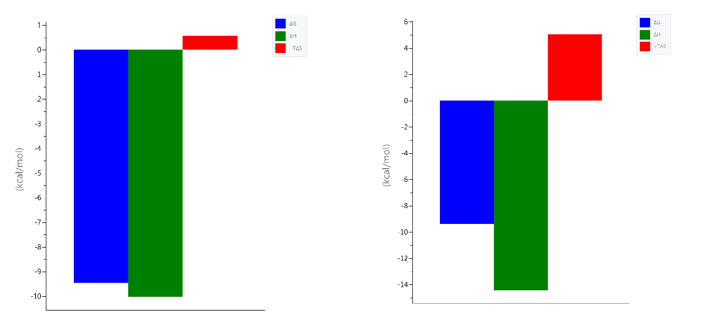
Conclusion: RBD of SARS-CoV-2 has more optimal interaction points, but this interaction leads to greater order in the RBDCoV2-ACE2 complex than RBDCoV1-ACE2, resulting in a more negative ΔS° component.
| RBDCoV1 | RBDCoV2 | |
| Kd ITC [nM] | 145.5 ± 25.0 | 144.0 ± 35.3 |
| ΔHITC [kcal/mol] | -10.50 ± 0.27 | -16.15 ± 0.60 |
| NITC | 1.03 ± 0.01 | 0.99 ± 0.02 |
| -TΔSITC [kcal/mol] | 1.15 | 6.81 |
Table 1. Differences in the hACE2 receptor binding thermodynamics between RBD of SARS-CoV-1 and RBD of SARS-CoV-2, at pH 7.4 and 25 °C
Figure 6. The signatures of the binding of left) SARS-CoV-1 RBD and right) SARS-CoV-2 RBD to the hACE2 receptor protein under the same experimental conditions (PBS buffer pH 7.4, 25 °C)
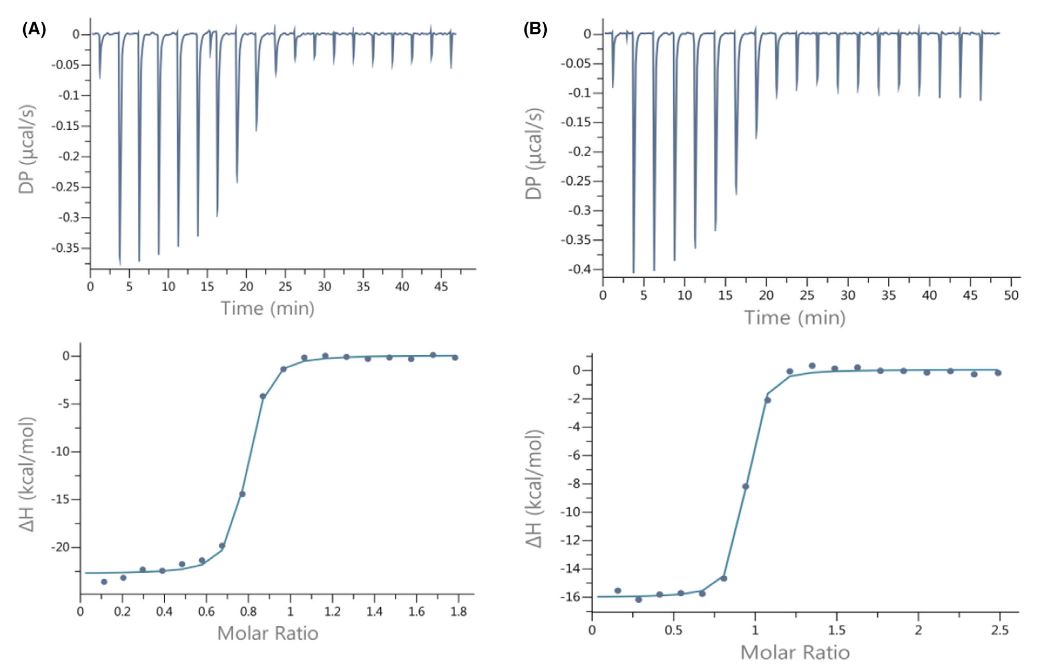
We hypothesized that the Ser477 residue might be critical for the RBD of SARS-CoV-2 and ACE2 interaction. In the Omicron RBD S477 is substituted with N, and that substitution, S477N, has positive impacts on the binding of the Omicron RBD to ACE2. We were interested if the negatively charged residue (Asp, D) will have opposite impact on RBD to ACE2 binding. The longer fragment of the S protein of SARS-CoV-2 (539 amino acid residues in total, including residues 319–591 of the RBD), named by us RBDCoV2b, was overexpressed for this part of our studies. The S477D mutant of RBDCoV2b was constructed and over-expressed. ITC measurements were then performed and the results compared (Figure 7).
Conclusion: The affinity of the SARS-CoV-2 RBD protein and its S477D mutant to the human ACE2 receptor was very similar (Kd = 20.1 _ 2.73 µM and 20.2 _ 4.22 µM, respectively).
Figure 7. Calorimetric titration isotherms of binding of (A) wild type SARS-CoV-2 RBD and (B) SARS-CoV-2 RBD mutant (S477D) to the hACE2 receptor protein under the same experimental conditions (TRIS buffer, pH 7.4, 25 °C)
Acknowledgments
We thank Kaci Erwin and Jason McLellan at the University of Texas (USA) for kindly providing the RBDCoV2b protein and its S477D mutant.
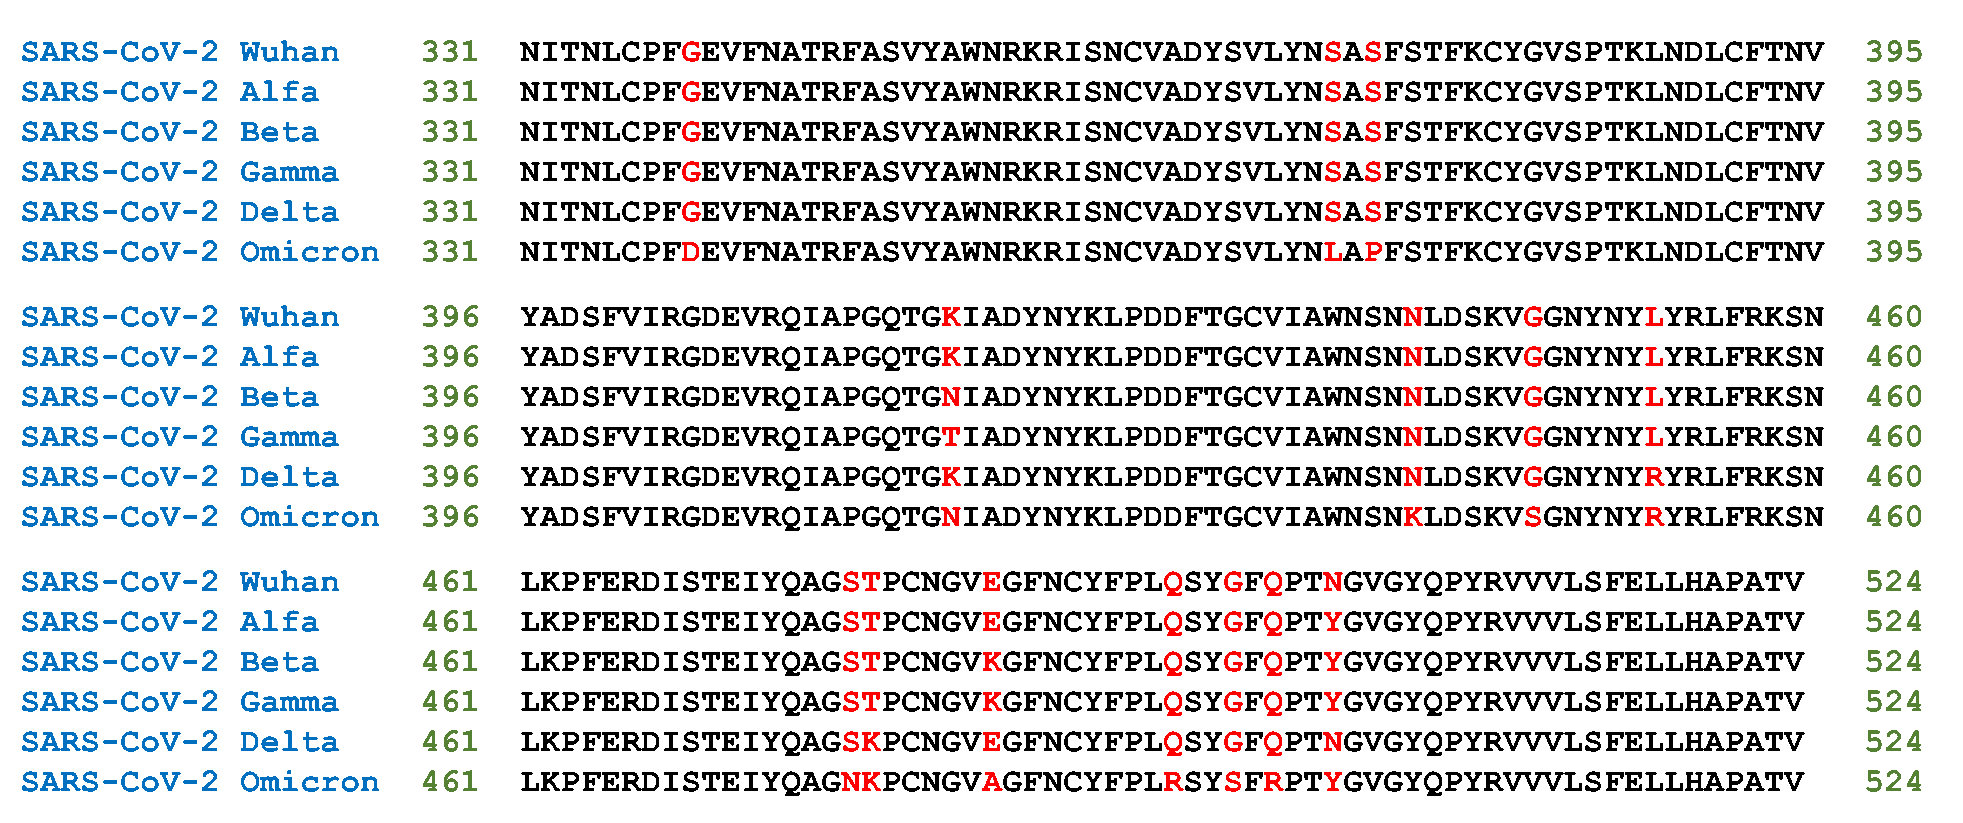
Mutations in RBD present in SARS-CoV-2 variants of concern, classified by the WHO, have emerged independently around the world (Figure 8). Mutations in the receptor-binding motif of the SARS-CoV-2 spike protein, particularly N501Y and E484K, have garnered significant attention due to their potential impact on ACE2 binding kinetics and strength, as well as their role in antibody escape. These mutations are hypothesised to contribute to the increased infectivity and pathogenicity of the virus. Notably, although N501Y and E484K provide a clear selective advantage for the virus, as highlighted in numerous studies, they are relatively distant from each other within the RBM.
Figure 8. Sequence alignment of SARS-CoV-2 S1 RBD. Variable amino acids residues SARS-CoV-2 identified in Wuhan and variants of concern are in red.
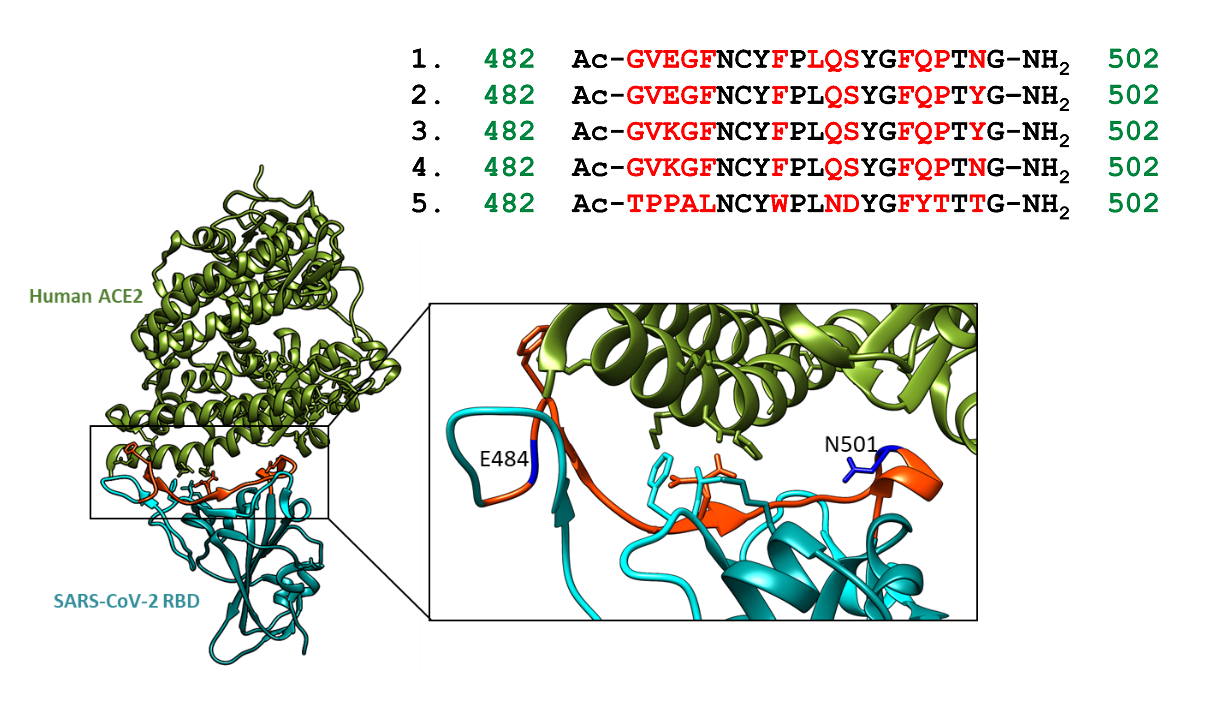
All previous studies investigating the effects of mutations on the ability of SARS-CoV-2 to bind to the ACE2 receptor were performed with the RBD or the entire S1 protein. To assess the role of each of these mutations (N501Y and E484K) on the binding of SARS-CoV-2 to ACE2, we generated RBM fragments (peptides), containing one or both of the above-mentioned mutations. The sequences of the analysed peptides (which make up part of the RBM motif of WT and the different SARS-CoV-2 variants) are shown in Fig. 9.
Figure 9. (A) Peptide sequences with common mutations (in red). (B) Overall structure of SARS-CoV-2 RBD bound to ACE2 receptor (B). Analysed fragment of RBM is shown in red, the variable amino acids are in blue. Visualised by USCF CHIMERA. PDB: 6M0J.
We conducted a comprehensive study that combined both theoretical simulations and experimental approaches. By comparing not only the binding strength but also the enthalpy of interactions, we aimed to provide a more definitive understanding of these interactions.
The ITC results suggest that all studied peptides comprising fragments of RBM of five SARS-CoV-2 variants (one fragment has this same sequence in Beta and Gamma variant, as shown in Fig. 9A), bind ACE2 with a stoichiometry 1:1 (Table 2).
| RBM fragments | KDITC [µM] | N | ∆HITC [kcal/mol] | – TΔSITC [kcal/mol] |
| WT | 4.74 ± 1.45 | 0.96 ± 0.13 | – 3.4 ± 0.68 | – 3.94 |
| Alpha | 2.15 ± 0.83 | 0.96 ± 0.14 | – 3.29 ± 0.70 | – 4.44 |
| Beta/Gamma | 0.31 ± 0.08 | 0.91 ± 0.02 | – 2.28 ± 0.09 | – 6.61 |
| Zeta | 0.81 ± 0.06 | 0.76 ± 0.03 | – 4.26 ± 0.24 | – 4.06 |
Table 2. Differences in the hACE2 receptor binding thermodynamics between studied RBM fragments of five SARS-CoV-2 variants, at pH 7.4 and 25 °C.
Each mutation alters the binding affinity (KDITC) of the spike protein for the hACE2 receptor. The N501Y mutation (present in the Alpha variant) and the E484K mutation (present in the Zeta variant) lead to a 2.20-fold and 5.85-fold increase in affinity, respectively. Notably, the highest affinity for the hACE2 receptor was observed in the RBM fragment containing both mutations, resulting in a 15-fold increase. These mutations co-occur in the RBM of the Beta and Gamma variants.
All four systems exhibit enthalpy- and entropy-driven behaviour (Table 2 and Fig. 10). The enthalpic contribution (-ΔHITC) is greater than the entropic contribution to binding thermodynamics only in the case of the Zeta peptide (single mutation E484K). Notably, a significant entropic contribution compared to the enthalpic contribution was found for the interaction between ACE2 and the peptide with both mutations (Beta/Gamma peptide). This may indicate changes in hydrophobic effects or conformational changes.
Figure 10. Thermodynamic signatures determined by ITC titrations of binding of the ACE2 for analysed RBM fragments of five SARS-CoV-2 variants, at pH 7.4 and 25 °C. ΔG is shown in blue, ΔH in green, ーTΔS in red, all data in kcal/mol.
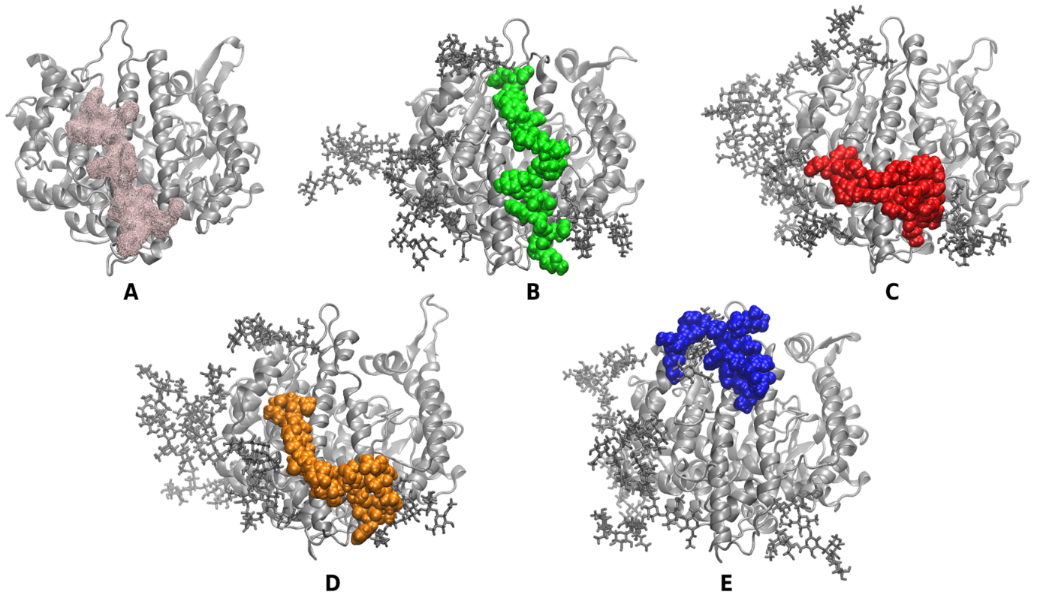
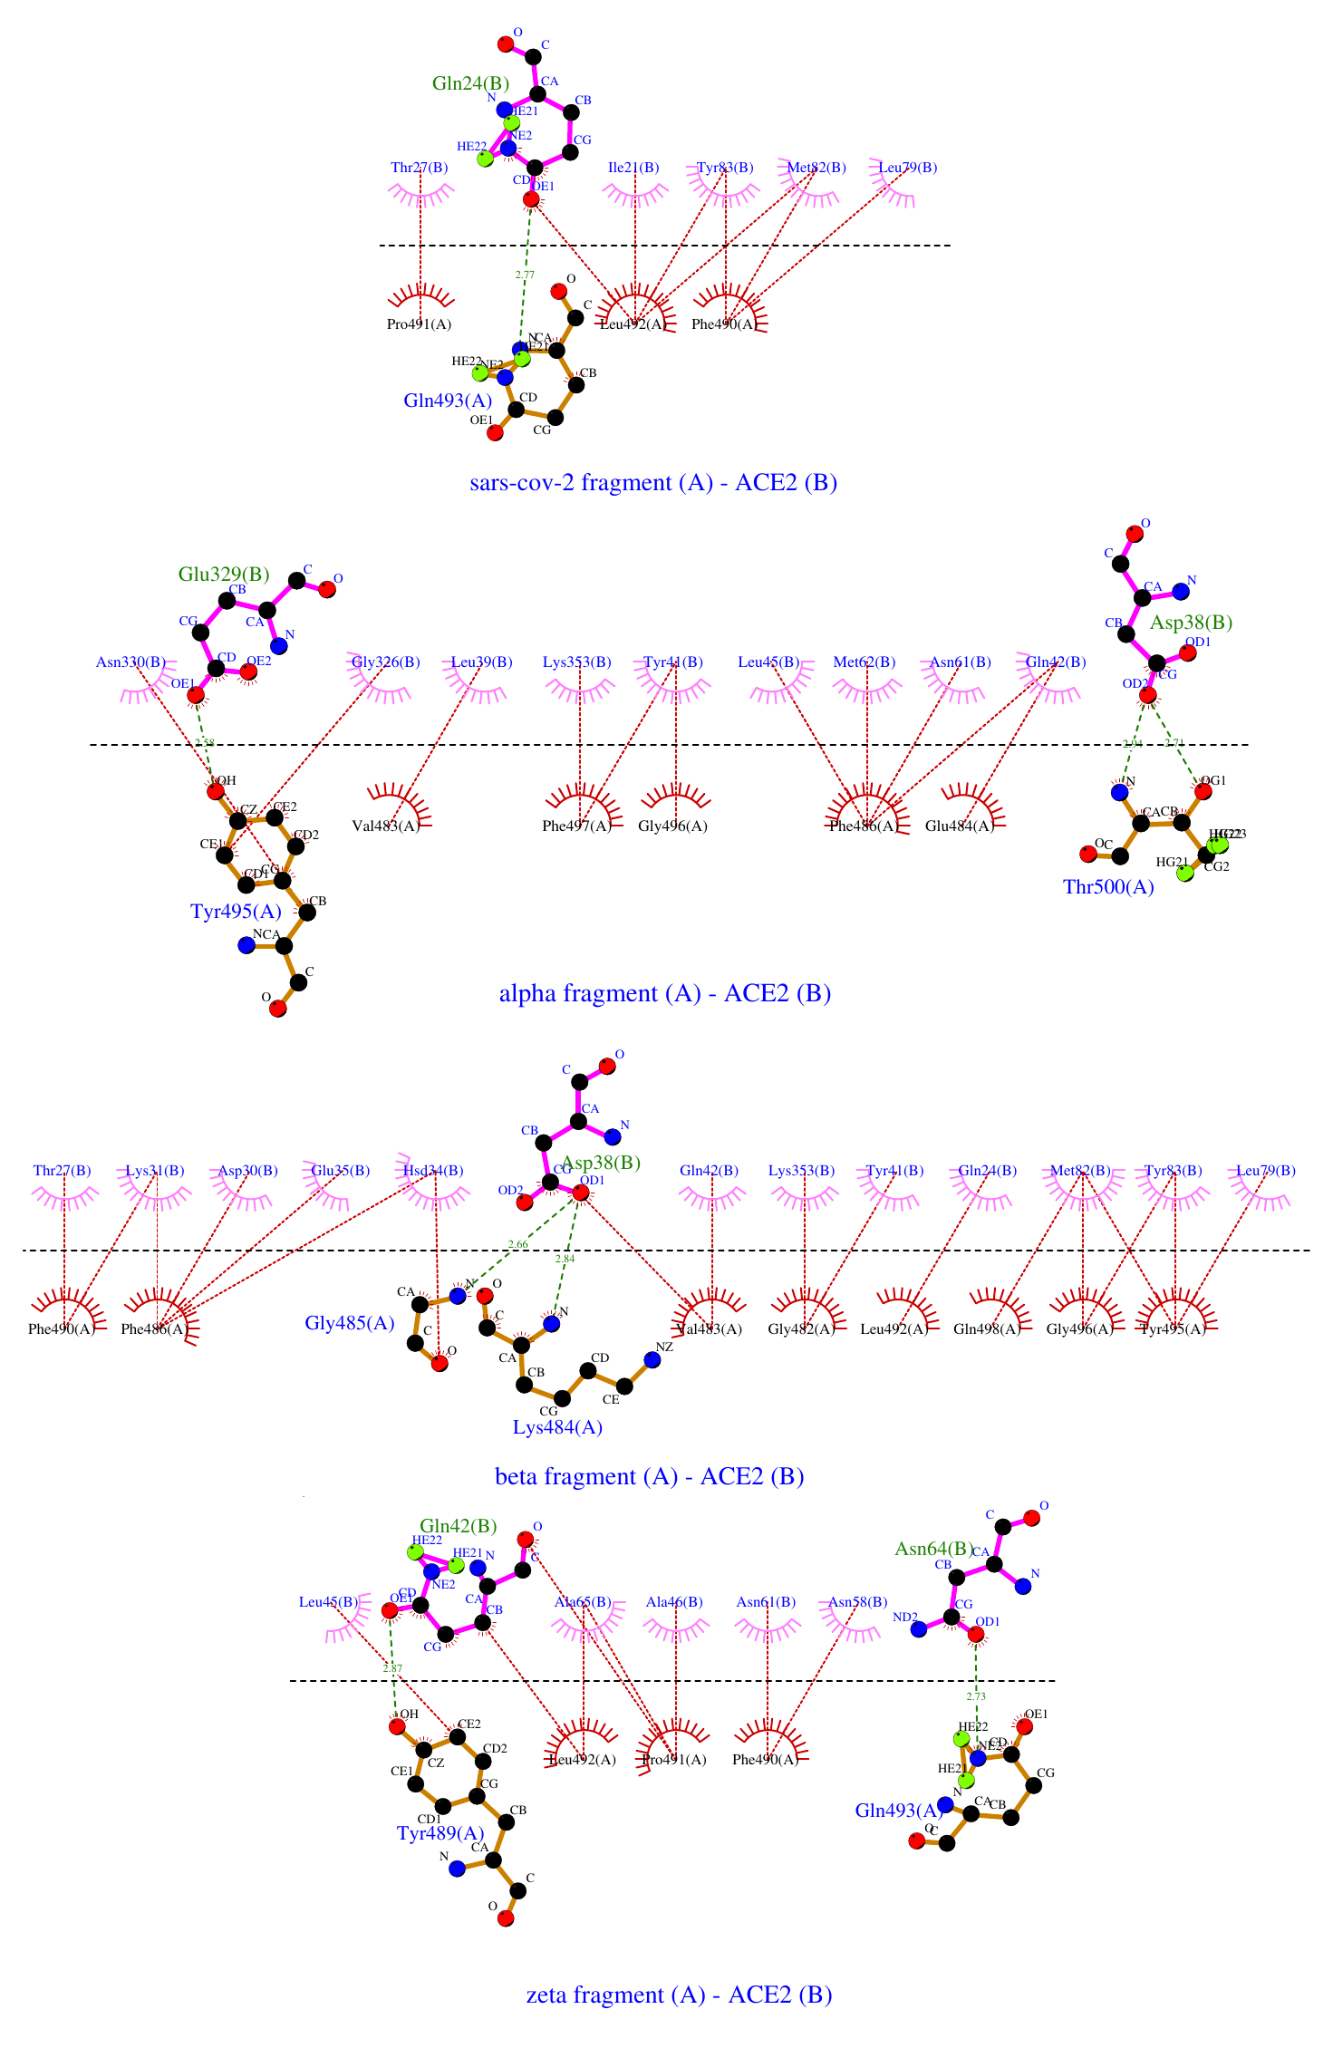
To elucidate the obtained experimental results on a molecular level, we conducted molecular dynamics (MD) simulations of the interaction of each of the WT, Alpha, Beta/Gamma, and Zeta fragments and the glycosylated hACE2 enzyme. We found that all peptides recognise the domain of the ACE2 receptor that is responsible for binding of the SARS-CoV-2 spike protein. However, there are some differences in the binding poses among the different variants (Fig. 11). Notably, the Beta/Gamma peptide fragment finds a second binding site on the receptor. Occasionally, the Zeta peptide also binds close to the same site. A summary of the interactions between the various peptide fragments and ACE2 for selected representative structures is shown in Fig. 12.
Figure 11. Binding of the peptides to the glycosylated hACE2. (A) The surface on the hACE2 enzyme of the SARS-CoV-2 spike – ACE2 binding interface based on experimental structures of the complex. The enzyme is depicted in silver cartoons and the binding surface – in a pink wireframe. (B-E) Binding poses of the WT (B), Alpha (C), Beta/Gamma (D), and Zeta (E) RBM peptide fragments. The peptides are depicted in green, red, orange, and blue Van der Waals surface, respectively.
Figure 12. 2D ligplot representation of peptide – ACE2 interactions. Covalent bonds are presented in solid brown lines in the peptides and solid purple lines in the ACE2 receptor. Intermolecular H-bonds are shown in dashed green lines with participating amino acids noted in green in the peptides and blue for the receptor. Hydrophobic contacts are depicted with brown dashed lines and arcs with radiating lines in magenta or red for the ACE2 and the peptides, and the relevant amino acids are noted in blue and black, respectively.
The in silico data suggests that the experimentally measured entropy contribution to the binding free energy correlates quite well with the number of hydrophobic contacts between the binding partners (Fig. 13A). With its 18 hydrophobic contacts with the receptor, the Beta/Gamma peptide has the largest entropy charge upon binding among the studied variants, confirming our previous suggestions. Moreover, this peptide also has an alternative binding pose, contributing additionally to the binding entropic term. The Alpha fragment forms about 60% fewer hydrophobic contacts (eleven) with ACE2 receptor, which agrees very well with the ~67% lower entropic contribution to its binding free energy, compared to the Beta/Gamma variant. The WT and the Zeta peptides form about eight hydrophobic contacts with the receptor and have similar valued entropic terms.
The binding enthalpies appear to depend less unambiguously on the number of hydrogen bonds formed between the peptide and the receptor. This may be due to the low number of amino acid residues, participating in H-bonds in both binding partners. However, the ligplot analysis in Fig. 12 does not take into account the H-bonds formed between the peptide fragments and the glycans of the hACE2. Once these are accounted for, there is a good correlation between the experimentally measured enthalpies in Table 2 and the number of H-bonds formed between the peptides and the glycosylated hACE2 (Fig. 13B).
Figure 13. Correlation between (A) the number of peptide–hACE2 hydrophobic contacts and the experimentally determined entropic contribution to the binding free energy, and (B) the number of H-bonds between the peptides and the glycosylated hACE2 and the experimentally measured enthalpy change upon binding. The values for the WT, Alpha, Beta/Gamma, and Zeta RBM fragments are shown in green, red, orange, and blue squares, respectively.
Our experimental results and simultaneous theoretical work support each other. The experimentally measured entropy contribution to the binding free energy correlates well with the number of hydrophobic contacts between the binding partners and is highest for the Beta/Gamma peptide. This peptide, which carries both the N501Y and E484K mutations, also has the highest affinity for the ACE2 receptor, as demonstrated by ITC results.
Thus, our findings not only reveal the thermodynamic implications of point mutations in sensitive areas within the SARS-CoV-2 RBM but also establish a correlation between the predicted entropy changes and the infectivity (related to binding affinity for hACE2) of the respective variants. It is important to note that other mutations in the S1 protein of SARS-CoV-2 can also alter the thermodynamics of binding to the ACE2 receptor. Nonetheless, our results suggest that investigating the thermodynamics of the RBM-fragments interaction with ACE2 could serve as a rapid and effective tool for evaluating the epidemic potential and infectivity of possible new variants of the virus that bear mutations in the RBM domain.

